CArouter Benchmarks: every model we measure, on one leaderboard
CArouter now publishes the benchmarks we run to choose the open-weight models we serve, on one leaderboard built to be read in seconds and ranked by quality, speed and context. Every figure names its hardware, quantization, date and author, and we are inviting AI labs and research teams to publish their own results beside ours.
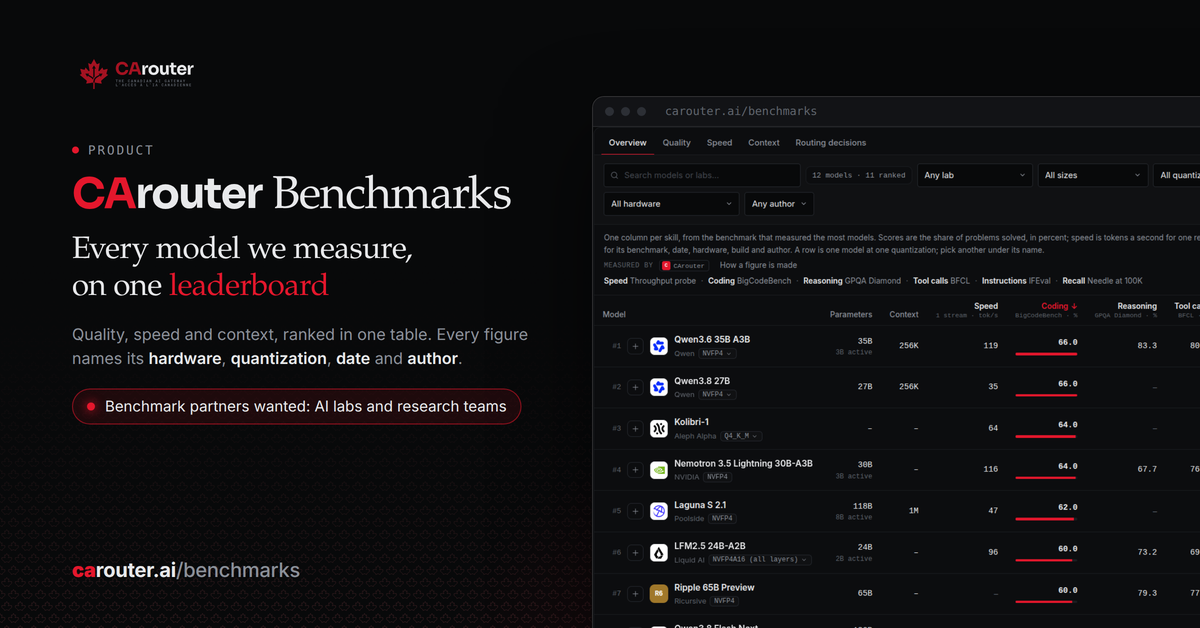
Before CArouter serves a model, we measure it: how well it answers, how fast it writes on a given machine and how much context it holds. These measurements come from our continued R&D, and until today each one lived in the blog post that reported it. They now sit side by side on one public leaderboard.
Designed to be read in seconds
Most of the work went into the interface. Every model sits in one table with its lab's logo, its size and its context window, and the columns are grouped the way a buyer thinks: quality, speed, context and routing decisions. A search bar and filters narrow the table by lab, size, quantization, hardware and author.
Each column names the skill first, such as coding, reasoning or tool calls, and the benchmark that measured it below. A click sorts the table on that column. The filters live in the page address, so a view can be shared as a link, and the + on any row builds a side-by-side comparison of up to three models.
Every figure carries its evidence
A figure earns trust when a reader can see where it came from. Hovering any cell shows its details:
- Hardware and build: the machine, such as an NVIDIA GB10 or an Intel Arc Pro B60, and the exact build, with its quantization, engine and engine version. A row is one model at one quantization, and a picker under its name switches to another.
- Date and samples: every figure is a dated run with its sample count. A new measurement is added beside the earlier one, which keeps its value.
- Author: every figure carries the mark of who measured it. When two authors measure the same model on the same benchmark, the page shows whether they agree within the benchmark's tolerance.
- One benchmark per column: the ranking follows the column you choose, because a single blended score would hide the trade-off between quality, speed and cost.
- Machine-readable copies: the same data is published at /benchmarks.json and in /llms-full.txt, for scripts and AI agents.
Where today's figures come from
The figures published today are the screenings we ran to decide which models CArouter serves, on which hardware and at which quantization. Each one links the article that first reported it. New measurements now run through an automated queue with the same protocol, and they reach the page as soon as they finish.
We are looking for benchmark partners
A leaderboard earns more trust when several independent teams stand behind it. We are looking for reliable benchmark partners, such as AI labs, research groups and hardware makers, to publish their own results on CArouter.
A partner receives its own key and submits a full set of results through our API. We review each set before it appears, and the partner's name stays on every figure it published. To take part, write to us through the contact page.
See the leaderboard. Read the methodology. Become a benchmark partner.