Greener tokens: the carbon footprint of every model, before you pick one
Every offer on our documentation page now shows an estimate of the carbon emitted to serve a million tokens, coloured by the grid it runs on. Why we publish it, the two inputs and one formula behind it, and what it leaves out.
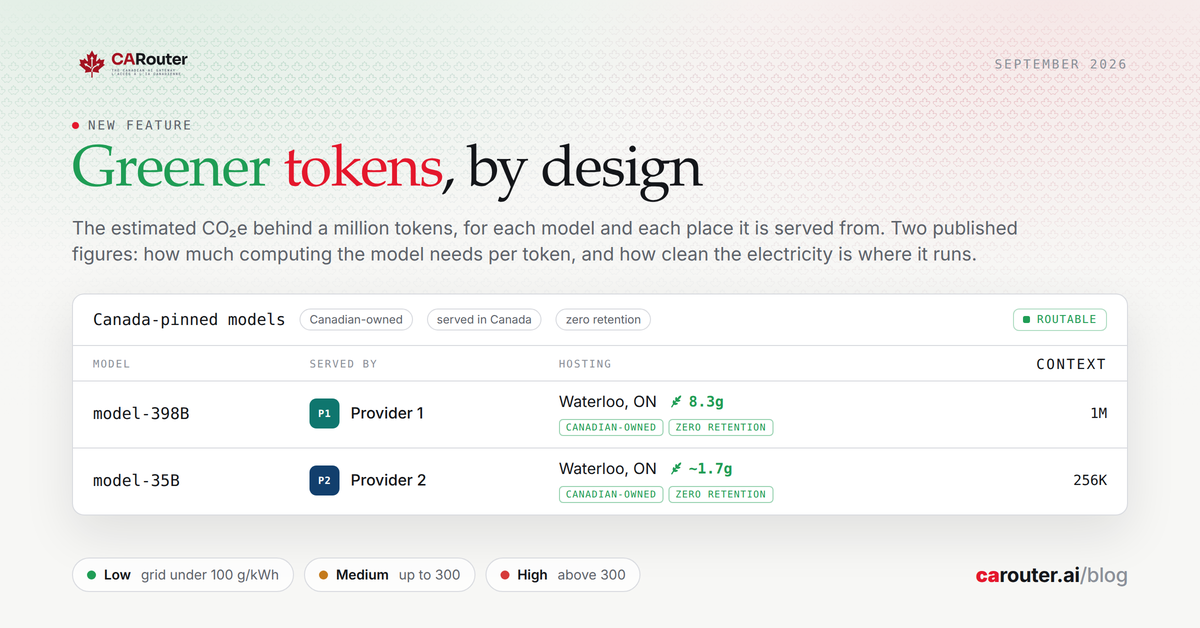
Every offer on our documentation page now carries a small leaf. Beside it is a number: an estimate of the carbon emitted to serve a million tokens from that model, at that provider. This post says why we publish it, how it is computed, and what it leaves out.
Why a number, and why now
How much electricity AI uses has become a public question, and a fair one. The people who choose CARouter are already making a deliberate choice about where their data goes. We think they deserve the same clarity about what their requests cost the grid, so that sovereign and sustainable can be one decision instead of two.
On 3 September the Government of Canada launched its Responsible Data Centre Development Principles. Two of the five ask data centres to minimize environmental impacts and to be transparent about them. We do not build data centres. We route requests to them. Transparency at our level means a figure beside each offer, with its method and sources, so that a customer can act on it. The principles, on canada.ca.
What the leaf says
- The figure. Grams of CO₂ equivalent per million tokens, operational electricity only, rounded to two significant figures.
- The colour. The serving grid's band: green below 100 g CO₂e per kWh, amber up to 300, red above. The grid, not the figure, because the grid is what you can act on by choosing where a model is served from.
- Per offer, not per model. The same model served from Quebec and from Alberta differs by two orders of magnitude. A per-model average would describe a grid nobody serves from.
- Or nothing. An offer whose model publishes no parameter count, or whose region has no sourced grid figure, shows no leaf. We do not fill a gap with a neighbour's number.
How it is computed
Two verified inputs and one published formula.
Energy comes from the model's active parameter count, the one its maker publishes on the model card. A forward pass costs two floating-point operations per active parameter per token, for prefill, decode, embeddings and rerank alike. On the H100-class serving constants Epoch AI published, that is about 0.006 kWh per billion active parameters per million tokens, cooling and distribution included.
Carbon intensity comes from the grid of the region the provider claims to serve from: the Canada Energy Regulator's figure for each province, RTE's for France, the Energy Information Administration's for the United States. Each row carries the year it describes and the URL it was read from. A provider that claims only Canada, without a province, is costed on the national average.
Multiply the two. For a model with 100 billion active parameters, 0.59 kWh per million tokens becomes, on the published grid figures:
- 0.7 g in Quebec, 8 g in British Columbia, 21 g in Ontario;
- 59 g on the Canadian national average;
- 220 g on the US average, and 280 g in Alberta.
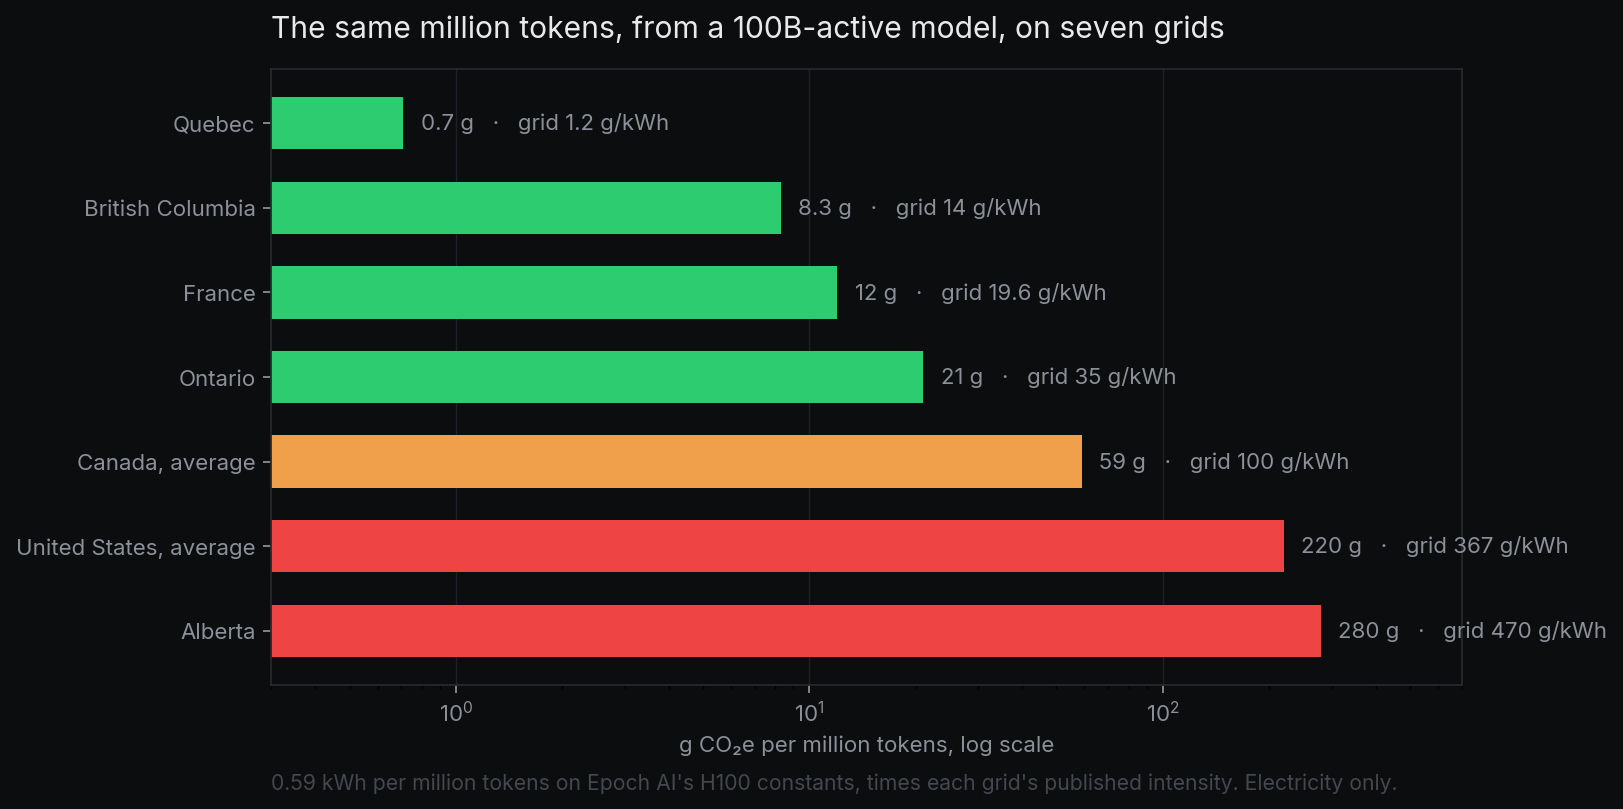
Same model, same tokens, a factor of four hundred between the cleanest and the dirtiest grid. That spread is the whole reason the figure is per offer, and the whole reason it is worth showing.
What it leaves out
- Embodied emissions from manufacturing the hardware, and the network in between. It is electricity for inference, nothing else.
- The provider's actual hardware. Every offer is costed on the same H100 constants, so the figure compares offers with each other and measures nobody's rack. A provider on newer silicon is over-counted, one on older under-counted, by a constant factor.
- Renewable certificates and supply contracts. The grid figure is location-based: a plug in Alberta draws Alberta's mix whatever the paperwork says, and a location-based figure cannot be gamed.
- Freshness. Grid figures are annual averages and drift like a price. The year on each row says how old it is, and re-reading the source is a maintenance duty we have taken on.
Using it to choose
Two habits pay off. Pick the smallest model that does the job, because energy scales with active parameters and a small model on a clean grid is the cheapest token there is. And when a model is served from more than one place, prefer the greener offer. In Canada, that is rarely a trade-off with sovereignty: hydro provinces are both.
The estimate is also in the machine-readable copy of our documentation, with the full methodology, so that an agent choosing a model on your behalf can weigh it too. The documentation page shows the leaf beside every offer that has one.